Figma Design System Analytics: Turn Usage Into Decisions
Read insertion activity, current instances and sampled adoption as different signals, then choose one evidence-based library action.
Use library analytics to choose what to inspect, distinguish action history from existing usage, and keep the reporting scope stable. Verify a concrete task before changing a component. Record evidence, an owner and a review date; usage alone cannot establish production quality.
Use Figma design system analytics to find where a shared library is used, investigate friction and choose a specific improvement. Separate insertion activity from existing instances, keep the same reporting scope, and inspect examples before changing a component. A usage count can guide an investigation; it cannot establish accessibility, production adoption or business value by itself.
Define the decision before the dashboard
Start with a question that someone can act on: which component should we investigate next, and what evidence would justify a change? A large total without a decision encourages more reporting. A bounded question gives the library owner a useful next step.
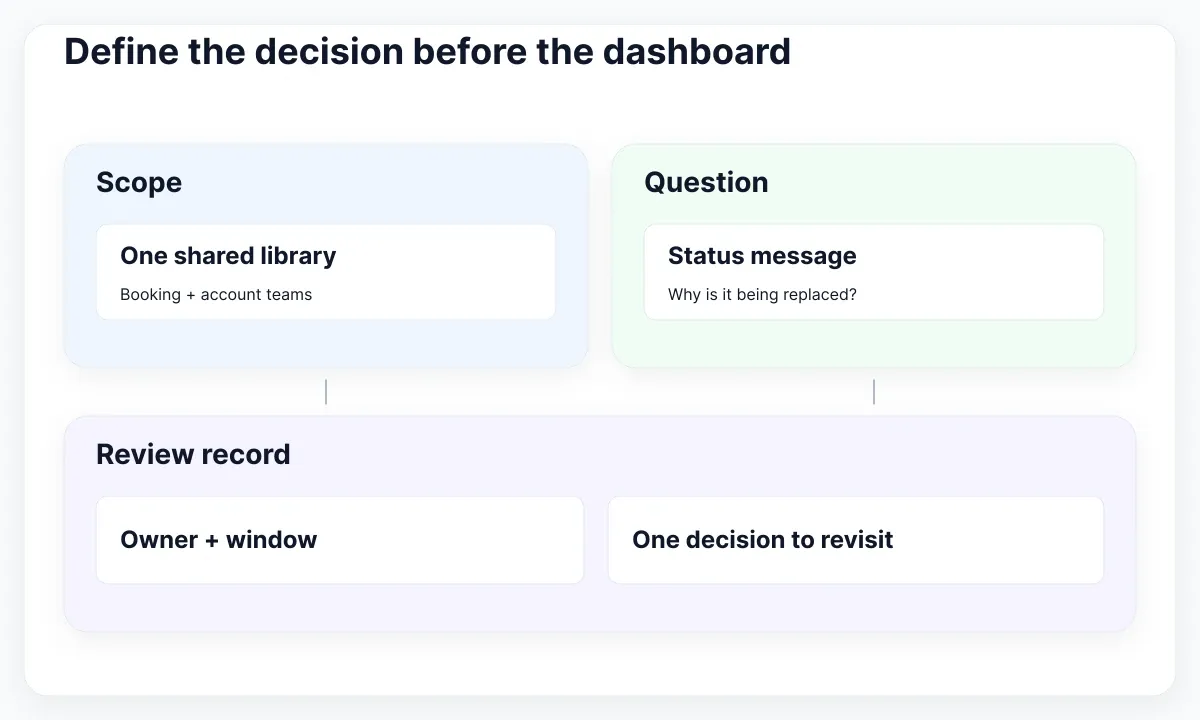
This guide proposes a review for Meridian, a fictional service with booking and account teams. Its shared library contains buttons, fields and status messages. The example numbers below are invented teaching fixtures, not EmviUI telemetry, Figma benchmarks or results from a customer. No organization analytics were accessed to write this guide.
Write a short review contract: one library, two named teams, one agreed observation window and one owner. Exclude training exercises from the manual sample. Record why those boundaries suit the question. If the team needs help defining ownership first, use the component-library architecture guide before measuring adoption.
The current Figma library analytics guide documents access for members on supported Education K–12, Organization, Government and Enterprise plans. In an accessible library file, deselect layers and use the file-name menu to open Library analytics. Check the current help page against your account rather than inferring availability from an old screenshot.
Our proposed question is deliberately small: why is the booking team replacing the shared status message? The decision might be to clarify documentation, add a missing state or leave the library unchanged. Define an owner and a review date for each possibility. Avoid deciding in advance that a new component must be the answer.
If analytics are unavailable, keep a clearly labeled manual review of agreed files. Write down who selected them and what was excluded. This can support a local maintenance decision, but it should not be presented as an organization-wide census or a substitute with identical coverage.
Separate activity from existing usage
Keep an activity view and a current-usage view side by side. They answer different questions, so give each its own unit, date and scope. This simple separation prevents a busy design week from being mistaken for a larger maintained implementation.
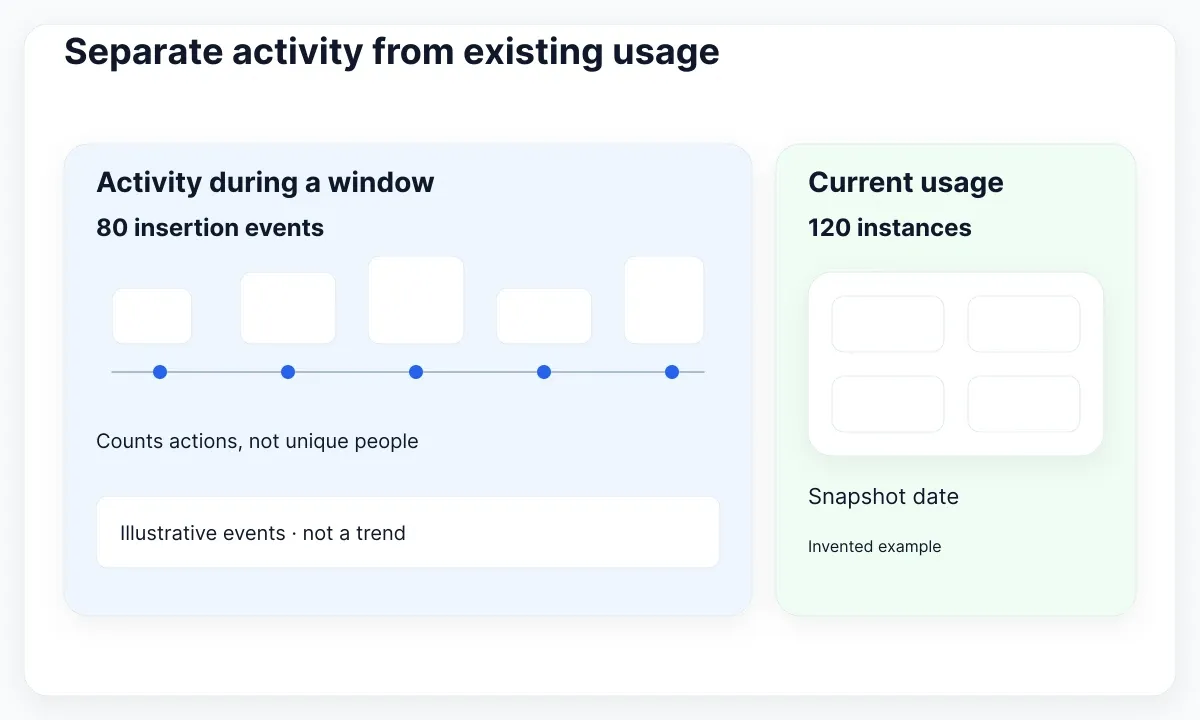
The Library Analytics API introduction distinguishes weekly actions from usage snapshots. In the component endpoint reference, insertion events can include duplicating or pasting instances; usage reports describe existing instances across files and teams. An insertion count is therefore not a count of unique people or shipped features.
For a fictional example, record 80 insertions during the window and 120 existing instances on the snapshot date. Do not subtract them to calculate retention. The stock may contain older work, and the events may include instances later removed. Instead, ask whether the 80 events reflect exploration, repeated layouts or a new product task.
| Review field | Illustrative value | Question to ask |
|---|---|---|
| Insertion activity | 80 events in the chosen window | What work caused the activity? |
| Current usage | 120 existing instances | Which files still depend on it? |
| Manual sample | Three agreed booking files | Does the pattern fit the task? |
Label any combination you calculate yourself as a local metric. If someone divides detaches by insertions, explain that it is an event ratio with potentially different populations, not a probability that a new instance will be detached. Prefer the original counts when that distinction would confuse the audience.
For Meridian, the useful output is a list of files to inspect and a short note about the work behind the activity. Keep the raw observations alongside the interpretation. A colleague should be able to disagree with the recommendation without losing access to the evidence that produced it.
Read a change with its denominator
A change becomes interpretable when you know what had an opportunity to change. Decide whether your denominator is a set of reviewed screens, relevant component opportunities or eligible teams. Keep that definition stable before comparing periods.
The Pinterest adoption case study explains why raw component counts did not fully answer its adoption question. It also distinguishes adoption measured in design from adoption measured in code. Treat its approach as a documented case, not a universal target or a ready-made formula for your organization.
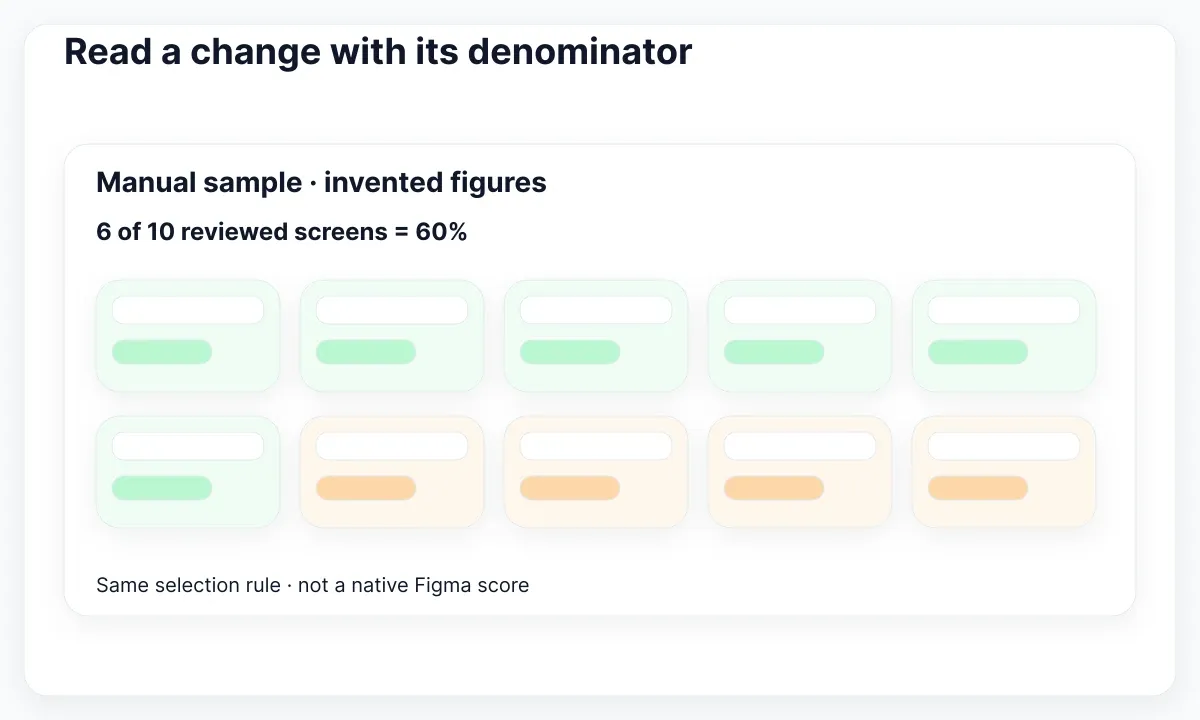
For our own manual example, inspect ten agreed booking screens. Suppose six use the approved status message wherever that message is needed. Report six of ten reviewed screens, or 60%, with the selection rule attached. Do not label this Figma’s native adoption score. The result says nothing about screens outside that small sample.
Next month, avoid quietly adding account screens to the denominator. Either repeat the original sample or publish a separate series with its own baseline. If a screen no longer contains the relevant task, explain its removal. Otherwise an improved percentage might simply reflect a changed sample.
Record release dates and major project changes beside the observations. A newly launched booking flow may increase instance counts while an archived experiment decreases them. Ask the file owner about both events before attributing the movement to library quality. This is a proposed review habit, not a causal conclusion from a chart.
Figma’s guidance on analytics and library structure discusses how organization and library boundaries shape useful comparisons. For Meridian, keep the current structure during the first review. Splitting libraries solely to improve a report creates maintenance work. Revisit that choice only when it also helps the people finding and maintaining assets.
Investigate detaches before changing the library
Treat a detach as the start of a conversation. Select an example, recover the original task and compare the required outcome with the available component. The goal is to understand a mismatch well enough to choose a proportionate response.
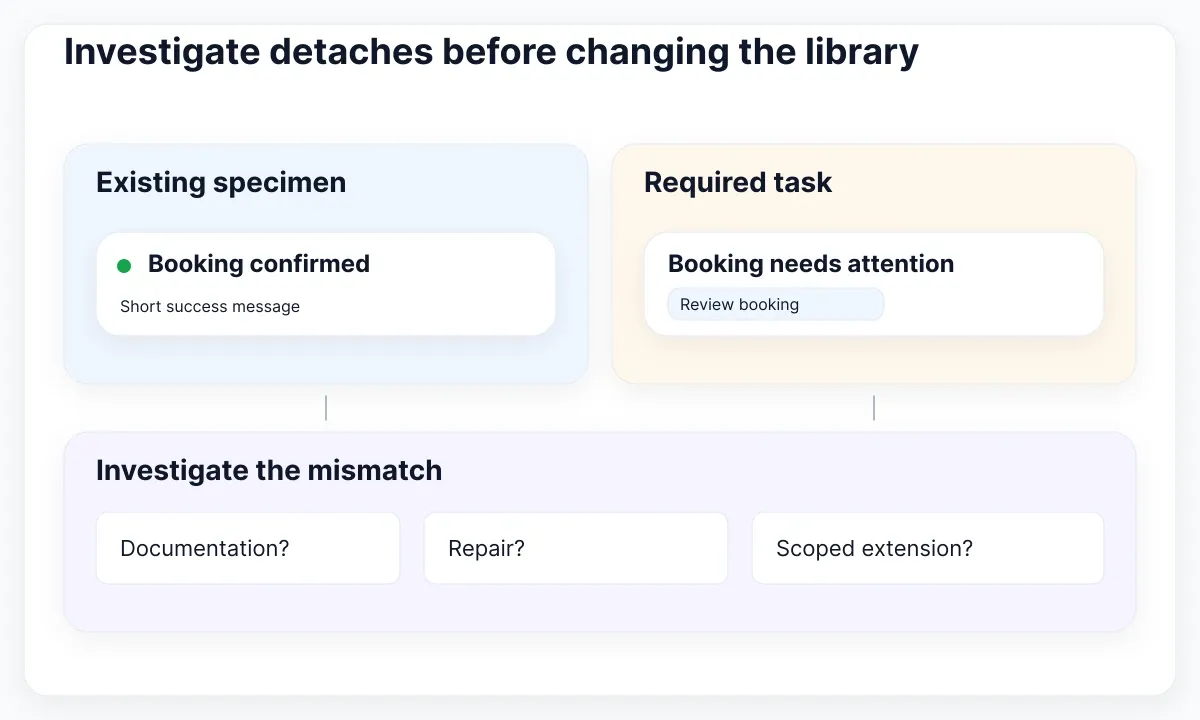
Figma’s Making Metrics Matter article describes detachment as a signal that can lead to questions about defects, missing capabilities or unexpected combinations. It does not establish that every detach is a failure. Keep your review focused on the design problem rather than ranking individual designers.
Ask Meridian’s booking designer to show one status message that was replaced. Perhaps the task needs a long explanation and a recovery action, while the existing example only communicates a short success state. Reproduce the need in a separate review copy. Record the content and available width before proposing another variant.
- Identify the original asset and the file where the mismatch occurred.
- Ask the owner what outcome the shared component could not express.
- Compare the requirement with current documentation and supported states.
- Choose documentation, repair, a scoped extension or a deliberate exception.
- Assign a reviewer and repeat the original task after the change.
Use the component source and update troubleshooting guide when the issue is a stale or incorrect source. That diagnosis differs from a missing product requirement. Avoid expanding the public component contract to compensate for an instance that was simply linked to the wrong asset.
Close the investigation with a concrete acceptance example: the message explains the booking problem, keeps its recovery action and works with the agreed long copy. Review keyboard behavior and semantics separately in the implementation. A successful design-library edit cannot by itself demonstrate those runtime properties.
Compare exports and explain missing data
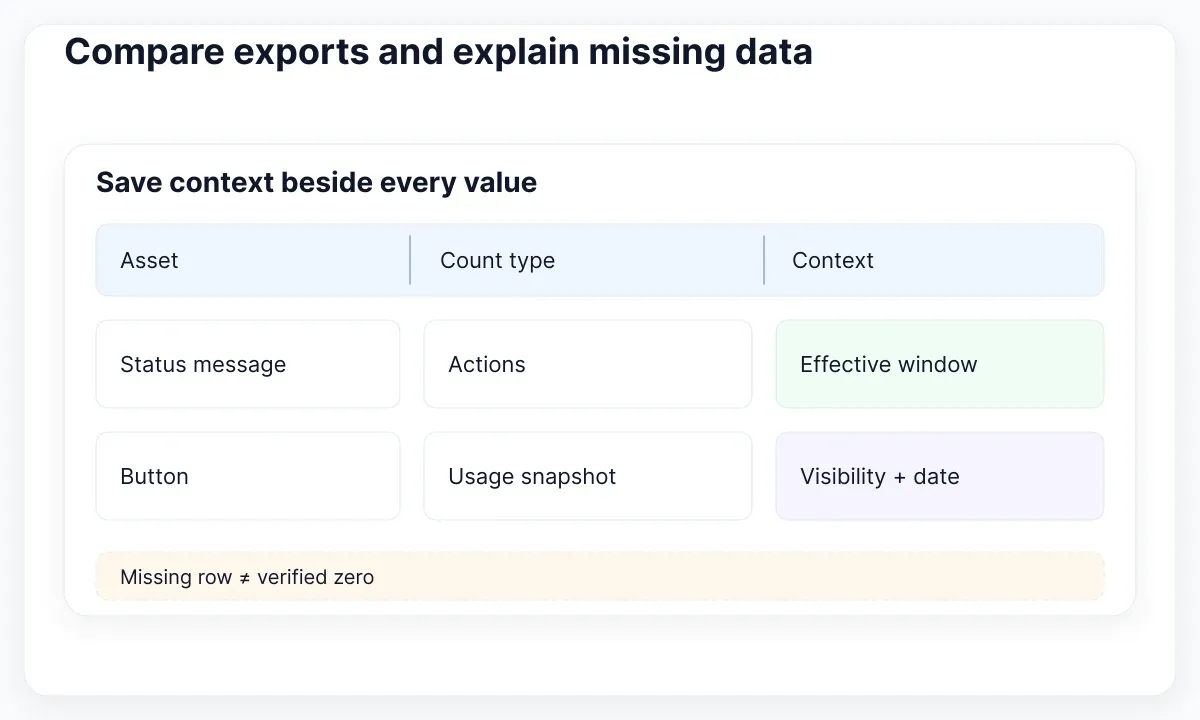
Make each saved observation repeatable. Store the library identifier, extraction date, asset type, grouping, window and visibility limitations beside the numbers. A chart that cannot explain its own scope is hard to use for a maintenance decision.
For an authorized automated export, the API access documentation currently requires Enterprise access and the library_analytics:read scope. Results follow permissions, can obscure file or team names and refresh daily. These requirements differ from opening the in-product panel; do not assume one access route guarantees the other.
The endpoint documentation warns that action data only returns weeks with data, while usage rows exclude unused components. Its action date filters are rounded to week boundaries. Preserve those semantics in your report. An absent row should not silently become a verified zero, and a requested date is not necessarily the effective reporting boundary.
For Meridian’s first review, a small saved observation sheet is enough. Use columns for asset, count type, effective period, sample note, interpretation and next action. Put the original export beside it. If access changes, annotate the break instead of connecting the old and new series as if their visibility were identical.
A useful missing-data note might read: account-team file details are not visible to the reviewer; ask its owner to confirm the sample. Do not try to infer restricted file names or report their absence as non-adoption. Keep the maintenance conversation with the team that can verify the context.
Before presenting a trend, have a second reviewer trace one reported value to its source and one recommendation to a concrete example. This proposed check is inexpensive and reveals mixed windows, renamed assets and unsupported interpretations before the numbers become a permanent dashboard.
Review an EmviUI specimen and record the next action
Pair usage observations with a direct inspection of a real design specimen. This catches issues a popularity measure cannot answer, including unclear naming or misleading sample labels. EmviUI can supply the editable visual reference for that review.
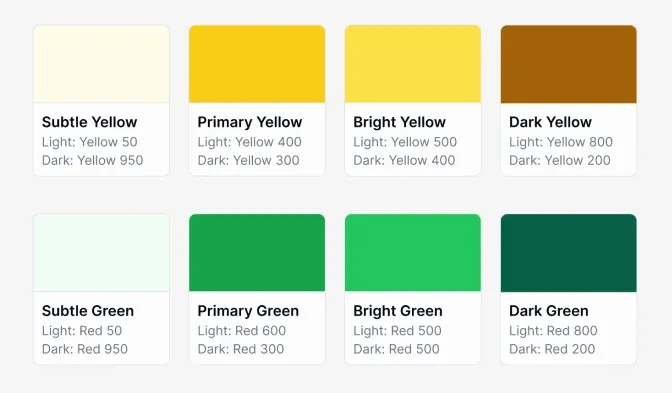
The EmviUI site presents a Figma UI kit and design system with reusable components and variables. The palette shown here is an EmviUI repository asset, not Figma’s analytics interface. In this exported specimen, green swatches have secondary labels containing “Red.” That visible inconsistency is a reason to inspect the source; it does not prove how variables are actually bound.
For a proposed review, choose one green role and compare its displayed name, intended purpose and actual binding in an authorized working file. Ask whether the problem belongs to the example artwork, a component label or the underlying shared value. Correct only the layer the inspection supports, and keep a before-and-after reference.
The same method applies to a frequently used button. High insertion activity would tell you where to look first; inspecting its labels, supported states and usage instructions would help identify the actual change. EmviUI does not supply your organization’s usage telemetry or establish that its examples are implemented correctly in your product.
If the review uncovers a genuine requirement for another component state, consult the guide to configurable and separate components. Keep that design decision attached to the original task and evidence. A new variant should earn its maintenance cost through a clear requirement.
Before closing, ask the owner to name the next observable outcome: a documented exception, a corrected label or a successfully repeated task. Agree on that outcome before the next reporting cycle.
End Meridian’s review with one action record: observation, evidence, owner, proposed change, acceptance example and next review date. An equally valid record can say no change, with a reason. Success is a better-supported library decision that the next person can revisit, rather than a larger total on the next chart.

Pablo Mayoral
Senior UX/UI & Web Designer with 10+ years of experience. Creator of EmviUI (10k+ components Figma design system), UImand, and Vitamin Bootstrap. Currently designing digital products at CQMRewards.