How to Fix Figma Lag: File, Browser and Memory Checks
A controlled workflow for locating slow Figma actions, testing changes and preserving the design work your team needs.
To fix Figma lag, compare the affected file with a small control, repeat the same action and change one factor at a time. Check the environment when every file is slow, inspect contents when one file fails, and collect a performance profile when the problem remains reproducible.
To fix Figma lag, first identify its scope: one file, one action, or every file in the same environment. Close unused Figma tabs, restart the affected session after checking that your work has synced, and repeat one simple action. Then investigate the branch that still fails: file memory and assets, browser graphics and extensions, or connection quality. Avoid deleting library content before you know which branch matters.
This is a practical diagnostic sequence, not a promise of a universal speed boost. Figma's official troubleshooting checklist supplies the initial checks; the controlled examples below are editorial recommendations for making those checks useful.
Locate the scope of Figma lag
Write the symptom as an action you can repeat. “Moving a card stalls in the billing file” gives you a test. “Figma is slow” does not identify whether opening, panning, editing, exporting, or presenting is affected.
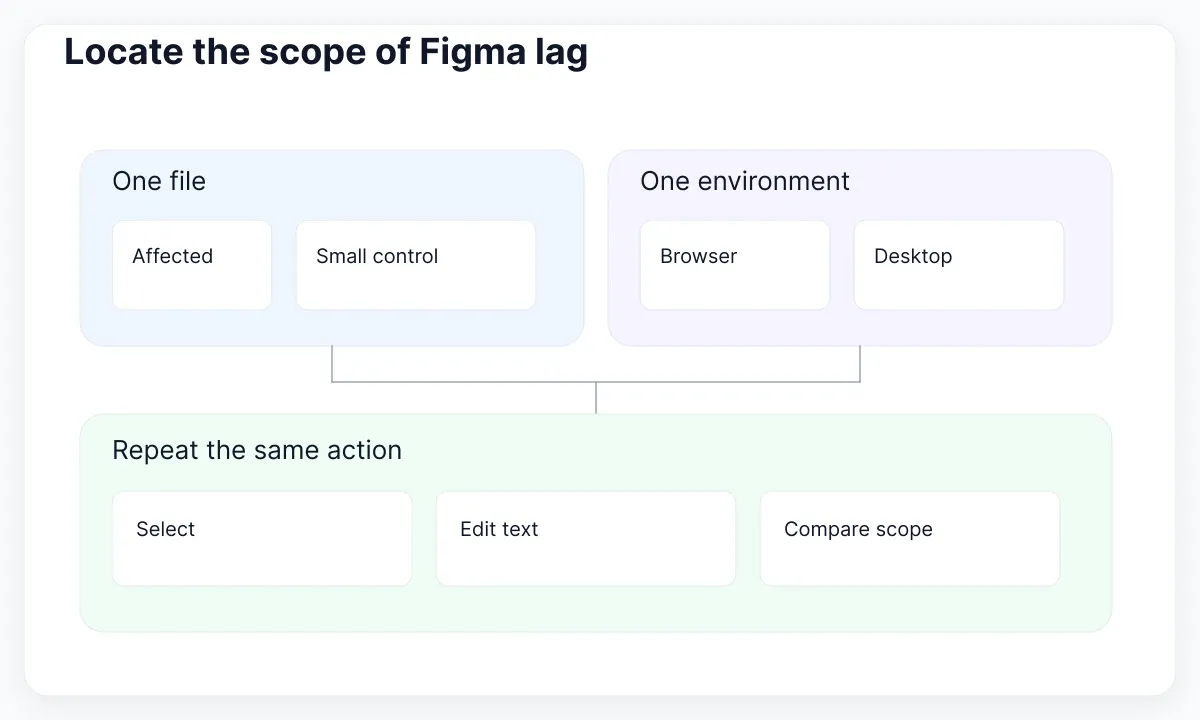
Start with three observations: the affected file, a small control file, and the same action in an alternative supported environment. For example, open the billing design and select a text layer. Next, select a comparable layer in a small scratch file. Finally, repeat the billing action in the browser if the desktop app is the original environment. Keep account, device, and connection constant where possible.
If only the billing file stalls, investigate its contents before changing machine settings. If both files stall in one browser but work elsewhere, inspect that browser. If colleagues report the same loading problem at the same time, check service status and connection conditions before reorganizing everyone's library. These observations narrow possibilities; they do not prove a cause.
| Observed scope | First investigation | Useful control |
|---|---|---|
| One file or page | Contents and memory | Small file, same environment |
| Every file in one environment | Browser or app configuration | Same file, alternative environment |
| Images or loading only | Assets and connection | Same view after loading settles |
A control should be simple enough to explain. An empty canvas cannot tell you much about editing a complex component; use a small text-and-button specimen instead. If the problem concerns presenting a flow, compare presentation with presentation rather than treating a smooth editing canvas as a successful test.
Build a repeatable baseline
Use a short test script before trying remedies. Open the same page, select the same frame, pan across the same region, and edit the same text. Record what pauses and when, without turning an estimate into a benchmark claim.
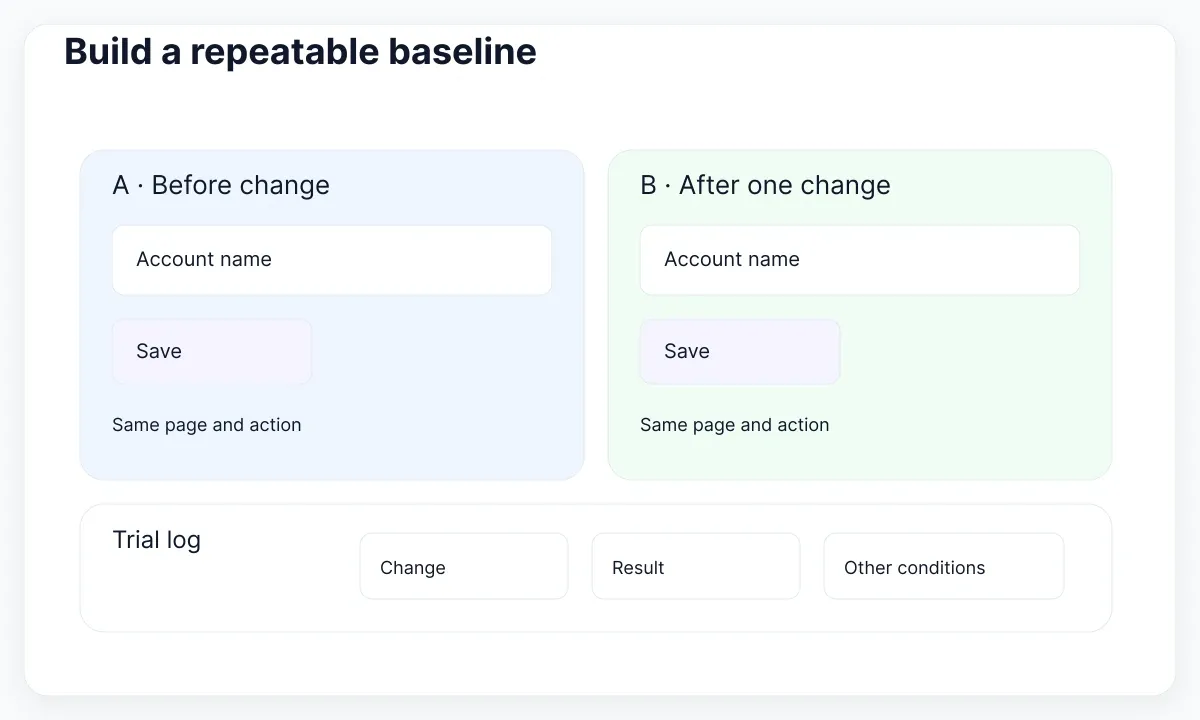
A useful note might read: “Desktop app, billing page, first pan after opening pauses; the next two pans are smooth.” Another might read: “Browser, every text edit pauses even after the file has settled.” Those two reports suggest different follow-up experiments. Include whether the symptom occurs on the first attempt only, continuously, or after a particular operation.
Change one factor per trial. Close unused Figma tabs and retest. If the symptom persists, restart the session and retest. If you change tabs, connection, browser, and file contents together, improvement will be hard to explain and impossible to reproduce confidently. Keep a small log with columns for the change, the repeated action, the result, and anything else that changed accidentally.
- Record the starting environment and action.
- Run the action several times and note the pattern.
- Make one reversible change.
- Repeat the same action under comparable conditions.
- Keep the change only if the result and usability justify it.
For a team review, choose an outcome people recognize: selecting and editing the target card feels responsive, opening the target page completes, or the image settles at usable resolution. Do not invent a frame-rate requirement from a diagram or promise a percentage improvement without measurements. A recording can document a visible pause, but its timing also reflects the recording setup.
If your “lag” is actually a component changing unexpectedly, use the variant-property troubleshooting guide. An override error needs a component repair, even when the resulting redraw makes it feel like performance trouble.
Check the browser and graphics path
When a small control file is also slow, inspect the environment before editing the main design. Confirm that your browser and operating system meet Figma's current system requirements. Browser and desktop comparisons are useful tests, but neither environment guarantees faster editing.
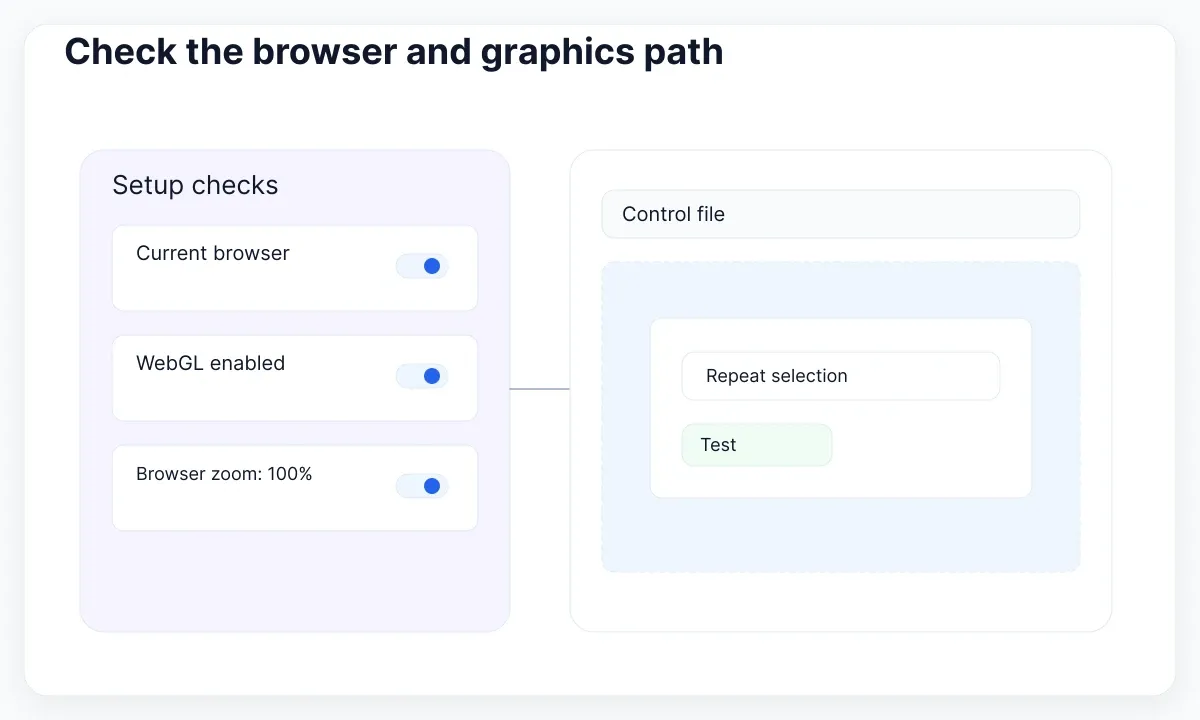
Figma's browser configuration guide calls for WebGL, current browser software, and browser zoom at 100%; its Chrome instructions include graphics acceleration. Browser zoom is separate from canvas zoom. Treat these as documented setup checks, then repeat the baseline rather than assuming a setting explains every delay.
Keep the comparison precise. If the same file works in one browser and stalls in another on the same device, record both versions and the graphics setup. Test an extension as a separate variable when it is a plausible contributor. Avoid disabling every extension permanently: a temporary, targeted comparison gives you better evidence about which extension matters.
On a managed computer, record settings you cannot change and ask the responsible administrator to investigate them. Repeatedly toggling security controls is a poor diagnostic habit. You can still provide the control-file result and identify whether the issue occurs in both the desktop app and browser. That information is more useful than a request to “make the laptop faster.”
A graphics-related hypothesis becomes stronger when a configuration change fixes the same action repeatedly. A single smooth attempt immediately after restarting is weaker evidence because several conditions may have changed. Also check that text editing, selection, and presentation still behave correctly after a remedy. The goal is a working design session, not an isolated smooth pan.
Do not start by buying hardware. First determine whether the problem follows the file, the environment, or a particular operation. Meeting minimum requirements and having a reproducible problem are separate facts; a supported setup can still need investigation.
Isolate heavy file contents
When the problem follows one file, inspect its memory and contents. Figma documents a memory view and layer-level indicators in its memory-management guide. Hidden content can still contribute; high-resolution assets and complex vectors are also investigation candidates.
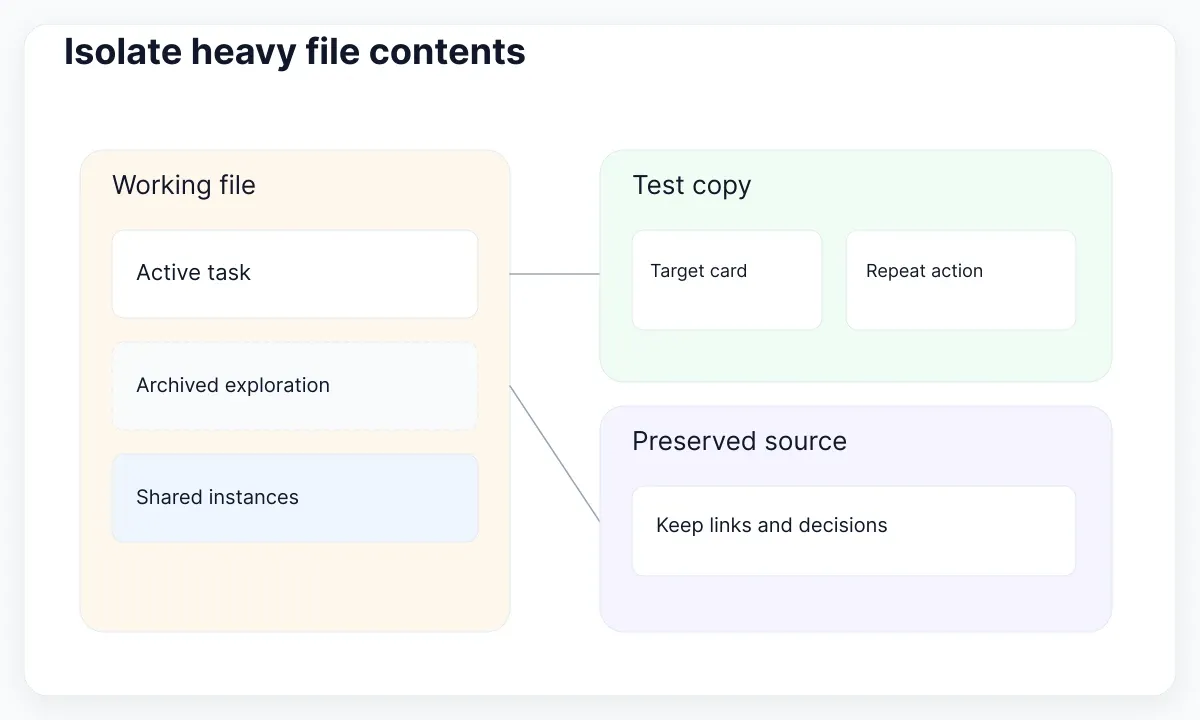
Use a disposable test copy to compare one suspect region with a smaller specimen. For example, if a large account-management page stalls when selecting a card, make a test page containing only that card and its immediate surroundings. If the symptom disappears, add nearby groups back in stages. This is a diagnostic recommendation, not proof that the removed group is defective.
Preserve what the team needs before removing anything from the working file. An abandoned experiment can still contain a decision, an edge case, or a component another designer expects. Label the archive, identify the owner, and agree on where active work belongs. Dividing active product areas into separate files may make everyday work easier, but the split must preserve collaboration and findability.
Be especially careful with published main components. A page containing instances and a library containing main components have different responsibilities. Do not treat deleting a library page like deleting a disposable scratch frame. Follow the documented library move process when applicable, and validate instance links and updates in a small consumer file before a broader move.
For a concrete test, compare a page containing one account card against a page containing the same card plus a large archive of explorations. Keep the card unchanged. If both are slow, the archive hypothesis is weaker; inspect another factor. If only the full page is slow, isolate content more carefully before committing to a permanent reorganization.
If layout movement rather than a pause is the problem, our nested Auto Layout sizing guide helps separate a sizing rule from a performance issue. Retain valid responsive behavior while testing simpler content.
Separate image loading from editing delay
A blurry image that sharpens later is a different symptom from a text edit that repeatedly stalls. Figma's image-loading documentation explains that image quality depends on the viewport and loading process; presentation images can also be affected by connection problems or extensions.
Compare the first visit to a region with a later visit after loading settles. Note whether the problem concerns image quality, delayed display, or the response to an edit. Replacing an image is not a meaningful test if the second trial happens only after other assets have finished loading.
In a test copy, substitute one oversized photo with a smaller asset that still suits the intended display. Retest the same interaction and inspect the visual result at the required size. Keep the original elsewhere. A lighter test asset is useful evidence only if it does not hide the design requirement you are trying to preserve.
For export problems, record the export operation separately from canvas editing. A smooth canvas does not establish that a large export is healthy. Similarly, an image that loads in the editor but fails in presentation calls for a presentation-specific comparison.
Prepare evidence for Figma support
Escalate a reproducible problem with a small, coherent evidence package. Figma provides an official method to record a desktop performance profile: open the developer tools, record the affected action, stop, and save the profile for the support conversation.
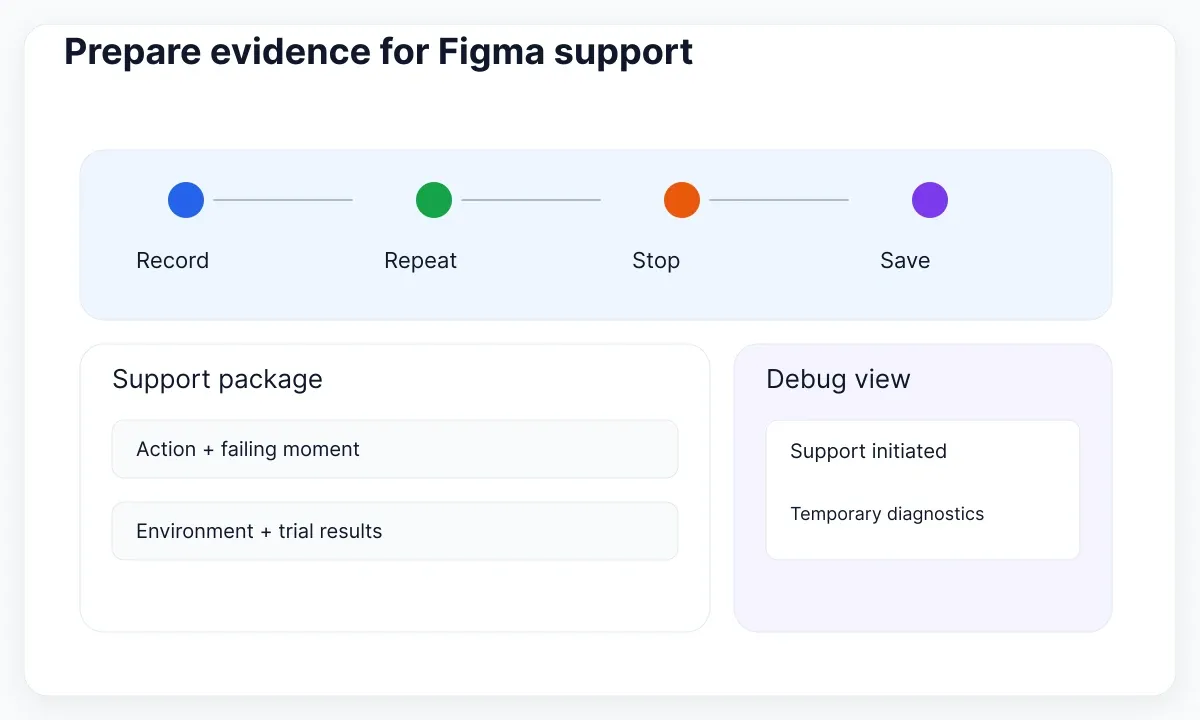
Record the shortest useful sequence. A long tour of unrelated pages makes the failing moment harder to identify. Pair the profile with a written action script and a note identifying the relevant moment. Include app or browser version, operating system, whether the control file also fails, and the changes already tested.
Here is an example support description: “Selecting the payment-summary frame pauses in the desktop app. The same frame is responsive in the browser on this device. A small control file is responsive in both. Closing other Figma tabs did not change the result. Attached profile reproduces selection twice.” This is an illustrative report, not a diagnosed Figma bug.
Figma's Debug view documentation describes a temporary tool initiated by support for deeper technical investigation. Do not present it as a user-facing speed setting. A performance profile and Debug view are different evidence paths; support can tell you which is appropriate.
Share diagnostic material through the support route your organization approves, and check the requested scope before attaching client work. A minimal reproduction can often explain the action without including an entire product roadmap. Keep the original issue log so a later fix can be retested using the same conditions.
Keep EmviUI working files focused
EmviUI's component catalogue provides Figma interface specimens that can help you build a realistic small control: a button, a card, and a text label. The kit supplies design material; it does not diagnose Figma internals or guarantee file-performance gains.
For a billing-screen example, start a small working file with the components needed for the task. Keep an exploration area and a documented route back to the maintained library. Compare an imported specimen against your adapted version when a slowdown begins after a major change. This helps you ask whether the symptom is attached to the original specimen, your adaptation, or the surrounding file.
Do not import a whole gallery solely to test one interaction. Equally, do not remove legitimate states merely to make the file smaller. A loading button, an error message, and a disabled action may all be required by the product. Keep the examples you need to test the user task, then decide how the wider library should be organized.
Use the UI kit and design-system scope guide to decide which material belongs in a local working kit and which requires shared maintenance. After a repair, reopen the working page and test the real task, including the longer label or narrow layout that originally mattered.
The practical finish line is a documented explanation and a usable file: what failed, what changed, what remained intact, and how another designer can repeat the check. If no experiment identifies a reliable remedy, retain the evidence and continue with support rather than labeling a temporary improvement as a permanent fix.

Pablo Mayoral
Senior UX/UI & Web Designer with 10+ years of experience. Creator of EmviUI (10k+ components Figma design system), UImand, and Vitamin Bootstrap. Currently designing digital products at CQMRewards.