Screens
Dashboard
A dashboard is a visual display of data used to monitor conditions and facilitate understanding, aiming to present information clearly and directly for quick decision-making.
Screens
A dashboard is a visual display of data used to monitor conditions and facilitate understanding, aiming to present information clearly and directly for quick decision-making.
A dashboard serves to present key information in a clear and direct manner. By visually displaying data through charts, graphs, and tables, it allows users to quickly grasp essential metrics and trends. This clarity is crucial for effective decision-making, as users can immediately understand the state of various conditions without having to sift through raw data.
Dashboards are designed to efficiently monitor conditions, providing real-time updates on important metrics. Whether tracking business performance, monitoring system health, or assessing project progress, a well-designed dashboard keeps users informed of current conditions at a glance. This enables timely interventions and adjustments, ensuring that goals are met more effectively.
The ultimate goal of a dashboard is to empower users to achieve their goals quickly. By aggregating relevant data into a single, easily accessible location, dashboards facilitate quick decision-making. Users can analyze the data presented, identify patterns or issues, and take action without delay. This streamlined approach enhances productivity and responsiveness, making dashboards an invaluable tool in various fields.
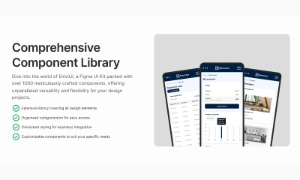
Our UI kit includes customizable dashboard components that help create visually appealing and highly functional dashboards, ensuring that users can monitor and understand their data with ease.

175 Variants
181 Variants
32 Variants
 Free
Free
264 Variants
 Free
Free
88 Variants

176 Variants
 Free
Free
32 Variants
144 Variants
 Free
Free
12 Variants

12 Variants
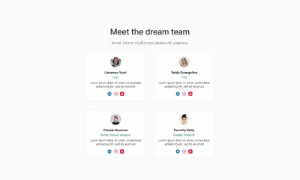
8 Variants

65 Variants

86 Variants
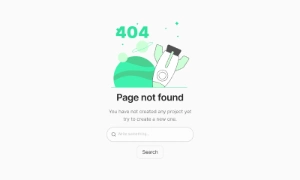
32 Variants